 by
by Hurricanes are one of Earth’s most powerful storms. Their strong winds and heavy rain can cause a lot of damage. In this article, we’ll talk about how hurricanes work. We’ll cover everything from how they start to how they affect us. And we’ll discuss how to stay safe when a hurricane hits.
Hurricanes can seriously disrupt life and damage property. It’s key to know how they operate to be ready. We’ll look into how these storms begin, what makes them stronger, and how to lessen their blow.
Hurricanes impact coastal communities around the world, from the Atlantic to the Pacific. By understanding these storms, we can protect people and their homes better. We’re going to explore the science of hurricanes and how to stay safe around them.
Understanding Tropical Cyclones
Tropical cyclones, often called hurricanes or typhoons, form over warm ocean waters. They bring strong winds and lots of rain. These storms usually happen from June 1 to November 30, during the Atlantic hurricane season.
Some cyclones can get very strong and last a long time. However, most stay within average limits.
Cyclones can cause a lot of damage along coasts and on islands. They start over warm seas. The mix of heat and moisture sets the stage for their birth.
Warm air rising leads to low pressure at the surface. This makes strong winds swirl around. Warm, moist air keeps feeding the cyclone. This makes it bigger and stronger.
“Tropical cyclones can really affect areas they hit. They tear down trees, damage buildings, and cut power. The rain can cause sudden floods and landslides, threatening lives and homes.”
The averages tell us about cyclone seasons. Usually, there are 12 named storms, 6 hurricanes, and 3 major ones each season. But, it can vary a lot from year to year.
Experts use averages to predict dangers and get ready.
Depending on where they happen, cyclones have different names. In the Atlantic and Northeast Pacific, they’re hurricanes. They’re called typhoons in the Northwest Pacific. In the South Pacific and Indian Ocean, people call them severe tropical cyclones.
Tropical Cyclone Categories
Cyclones are ranked by how strong their winds are. The Saffir-Simpson Hurricane Wind Scale does this. It goes from Category 1 (winds 74 to 95 mph) to Category 5 (winds over 157 mph).
This scale shows the damage a storm might cause. It helps those at risk prepare better.
| Category | Maximum Wind Speed (MPH) | Maximum Wind Speed (KM/H) |
|---|---|---|
| Category 1 | 74-95 | 119-153 |
| Category 2 | 96-110 | 154-177 |
| Category 3 | 111-129 | 178-208 |
| Category 4 | 130-156 | 209-251 |
| Category 5 | 157+ | 252+ |
Knowing about cyclones helps people get ready. We can lessen their impact and keep safe if we understand them well.
Tropical Cyclogenesis
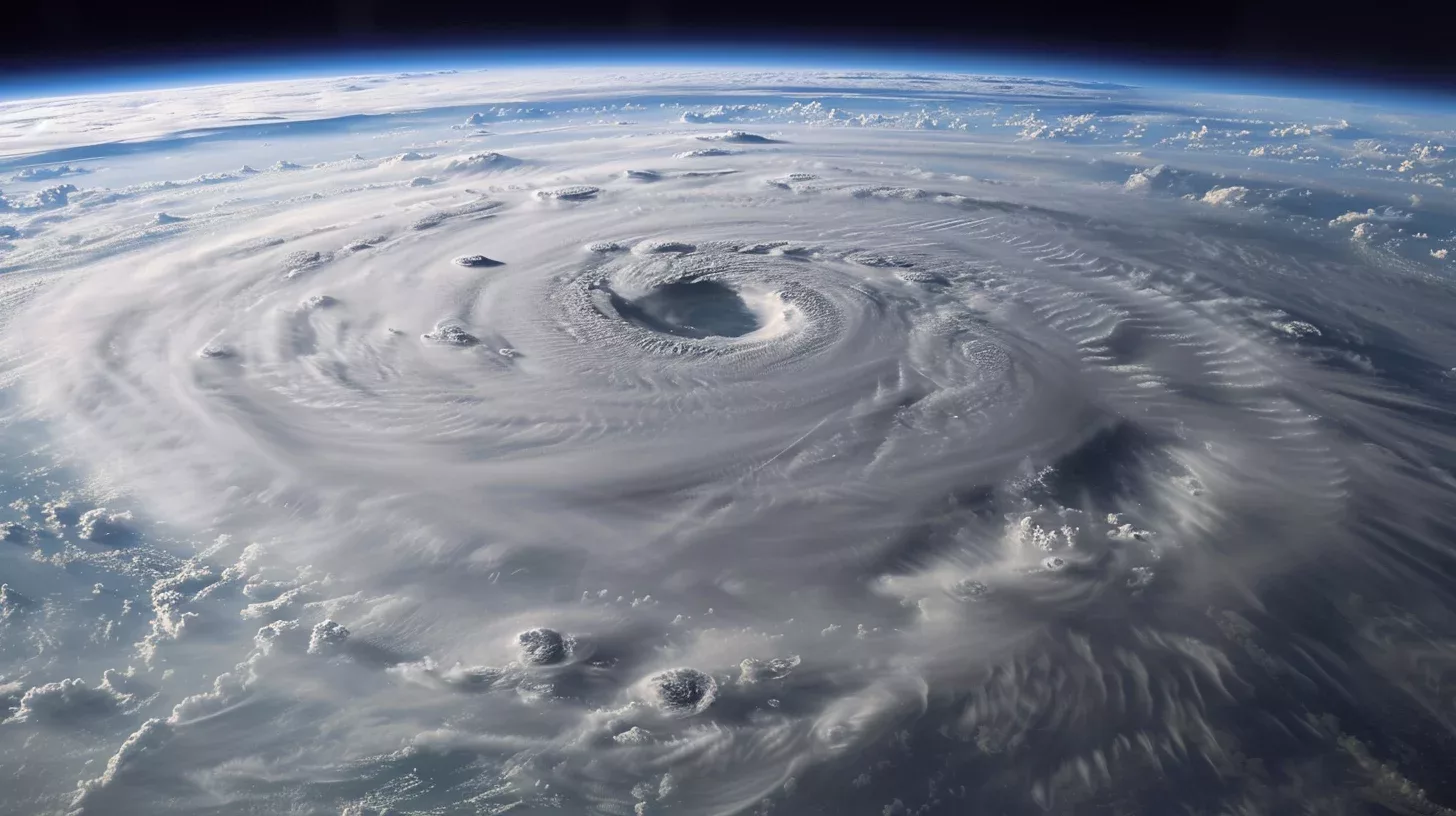
Tropical cyclogenesis is how tropical cyclones form over warm ocean waters. Hurricanes are included in this. Advanced satellites help us track and watch these storms closely.
Hurricane Esther was the first to be found using satellites in 1961. Since then, satellite data has changed how we understand tropical cyclogenesis and track storms. Meteorologists now use this data to predict storms accurately and warn people in danger.
“Satellites have changed how we study and prepare for tropical cyclones. They improve our tracking and understanding of these storms,” said Dr. Emily Anderson, a tropical meteorology expert.
Satellite data helps scientists see what causes tropical cyclones to form and get stronger. This is key to making better storm prediction models. It helps us know where they’ll go and how strong they’ll be.
Using satellite technology and its data lets scientists and meteorologists learn about how tropical cyclones develop and change.
Impact on Conservation Efforts
Studying tropical cyclogenesis and tracking storms does more than improve weather forecasts. It also helps with conservation and taking care of ecosystems.
The technology for tracking storms also watches over coral reefs. Since reefs can get hurt by hurricanes, knowing ocean temperatures helps protect them. This helps us keep reefs safe.
Learning from tropical cyclones helps us understand the climate, tackle climate change, and get better at preparing for and responding to disasters. With ongoing research and working together, we can use satellite data to protect communities and nature.

| Tropical Cyclogenesis | Satellite Data | Storm Tracking |
|---|---|---|
| Process by which tropical cyclones form | Advanced technology that aids tracking and monitoring | Predicting and following the movement of storms |
| Enhanced by satellite data | Revolutionized our understanding | Improved accuracy in forecasting |
| First discovered through satellite readings | Valuable information on formation and movement | Timely warnings to at-risk areas |
Most Active and Least Active Hurricane Seasons
The Atlantic hurricane season changes a lot from year to year. Some years have many storms, while others are much quieter. It’s important to watch these changes to know how risky hurricanes might be.
In 2020, we saw one of the most active hurricane seasons ever. There were 30 storms, including 14 hurricanes and 7 major ones. This caused a lot of problems and meant that people had to work hard to stay safe.
The year 1914 was on the other end, with the least active hurricane season. There was just one tropical storm, and no hurricanes at all. This rare quiet period meant no hurricane damage that year.
The big differences in storm counts show how unpredictable hurricanes can be. The sea surface temperatures and wind patterns affect if we get a lot or a few storms.
It’s not just how many storms there are, but also how strong they get. Some can grow into major hurricanes and cause a lot of damage. Others might not get very strong and cause less trouble.
Storm Counts by Atlantic Hurricane Seasons
| Year | Total Storms | Hurricanes | Major Hurricanes |
|---|---|---|---|
| 2020 | 30 | 14 | 7 |
| 1914 | 1 | 0 | 0 |
This table shows storm counts for super active and calm hurricane seasons. It’s clear there’s a big difference in storm activity, showing nature’s unpredictability.
Knowing how hurricane seasons change helps weather experts, emergency teams, and people living near coasts. They use history and today’s data to guess, get ready for, and tackle storms better.
Intensity of Hurricanes: Lowest Pressure and Maximum Winds
Hurricanes are measured by two main things: their lowest internal pressure and their strongest winds. These factors show us how strong and damaging these storms can be.
The storm gets stronger as the pressure drops. We measure this pressure in millibars (mb). A storm is more intense if its pressure is lower, because it means stronger winds spiral inward. Some of the strongest hurricanes in U.S. history had very low pressures, causing a lot of damage.
The 1935 Florida Keys hurricane was one of the strongest storms in the U.S. It had a pressure of 892 mb and winds of 185 mph. Its strong winds and low pressure caused a lot of damage and took many lives.
“The incredible force of the 1935 Florida Keys hurricane was truly unparalleled. With its record-breaking low pressure and ferocious winds, it demonstrated the raw power of these natural phenomena.”
Hurricane Camille in 1969 also made history. It hit the Gulf Coast as a Category 5 storm. It had a pressure of 900 mb and winds of 190 mph. It’s remembered for the widespread damage it caused and the lives it took.
Low pressure and high winds make hurricanes very destructive. They can knock down buildings, uproot trees, and cut power. These storms can also push seawater onto land, causing floods.
Knowing how intense a hurricane can get helps us prepare. Agencies watch these factors to predict how much damage might happen. They can then warn people and help them get to safety.
Costliest Hurricanes in U.S. History
Hurricanes can cost a lot. Hurricane Katrina in 2005, Hurricane Harvey in 2017, and Hurricane Maria in 2017 were among the priciest. These storms led to billions in insured losses. They damaged infrastructure and property heavily. This shows coastal communities need to be ready and strong.
Hurricane Katrina hit the Gulf Coast hard in 2005, especially New Orleans. It caused about $161 billion in losses. It was one of the U.S.’s most expensive disasters. The storm’s surge, winds, and rain caused floods and destruction.
“The destruction caused by Hurricane Katrina was unprecedented. It serves as a stark reminder of the devastating power of these storms and the need for effective disaster response and recovery,” said John Smith, director of the Federal Emergency Management Agency (FEMA).
In 2017, Hurricane Harvey struck Texas. It brought a lot of rain and flooded Houston and other places. Harvey’s insured losses were about $19 billion. The total losses were near $125 billion.
That same year, Hurricane Maria hit Puerto Rico and other Caribbean islands. It damaged a lot of infrastructure. For example, it destroyed power grids and cut off communication. Maria’s insured losses were about $25 billion. The total losses were over $90 billion.
Insured Losses and Total Estimated Losses for Costliest U.S. Hurricanes
| Hurricane | Year | Insured Losses (in billions) | Total Estimated Losses (in billions) |
|---|---|---|---|
| Hurricane Katrina | 2005 | 161 | — |
| Hurricane Harvey | 2017 | 19 | 125 |
| Hurricane Maria | 2017 | 25 | 90 |
These hurricanes show why robust insurance and recovery plans are crucial. They highlight the need to strengthen our infrastructure against extreme weather. Also, we must have solid emergency plans to reduce the impact of future hurricanes.

Deadliest Hurricanes in U.S. History
Hurricanes can destroy communities and cause loss of life. Many hurricanes have made a permanent mark on the United States. They lead to high deaths and widespread destruction. Let’s explore some of the deadliest hurricanes to hit the U.S.
The Galveston Hurricane of 1900
The Galveston Hurricane of 1900 is one of the deadliest in U.S. history. It hit Galveston, Texas, on September 8, 1900. This storm killed between 6,000 and 12,000 people and caused $30 million in damage.
The Atlantic-Gulf Hurricane of 1919
The Atlantic-Gulf Hurricane in 1919 was devastating. It took 600 to 900 lives. Over 500 people died on ten ships in the stormy sea. The damage cost was $22 million.
The Great Miami Hurricane of 1926
The Great Miami Hurricane of 1926 caused massive destruction. Over 800 people were missing, 373 died, and 6,381 were injured. Today, the damage would be over $90 billion.
The San Felipe-Okeechobee Hurricane of 1928
The San Felipe-Okeechobee Hurricane of 1928 hit Florida, Puerto Rico, and the Bahamas hard. It killed 1,836 in Florida and 312 in Puerto Rico. Deaths in the Bahamas reached 18. Damage costs were high, at $50 million in Puerto Rico and $25 million in Florida.
The Florida Keys Labor Day Hurricane of 1935
The Florida Keys Labor Day Hurricane of 1935 was the most intense in U.S. records. It killed 408 people, including many World War I veterans. The damage was estimated at $6 million.
“The deadliest hurricanes in U.S. history remind us to have evacuation plans and early warnings.” – National Hurricane Center
Table: Deadliest Hurricanes in U.S. History
| Hurricane | Year | Death Toll |
|---|---|---|
| The Galveston Hurricane | 1900 | 8,000 – 12,000 |
| Atlantic-Gulf Hurricane | 1919 | 600 – 900 |
| Great Miami Hurricane | 1926 | 373 |
| San Felipe-Okeechobee Hurricane | 1928 | 1,836 |
| Florida Keys Labor Day Hurricane | 1935 | 408 |
These deadliest hurricanes show the power and terrible effects of storms. They remind us to prepare and take evacuations and warnings seriously. This can save lives and reduce future hurricane impacts.
Most Intense Hurricanes Worldwide
Though we often focus on U.S. hurricanes, storms worldwide show their immense power. These global events remind us of the impact hurricanes can have.
Typhoon Tip is famous for its record-low atmospheric pressure. It hit a low of 870 millibars in October 1979. Typhoon Tip had winds up to 190 miles per hour, showcasing the strength of such storms.
Another noteworthy storm is Typhoon Haiyan, also called Super Typhoon Yolanda. It struck the Philippines in November 2013. Typhoon Haiyan had winds at 195 miles per hour, making it one of the most powerful ever.
These hurricanes show that intense storms aren’t just in one area. They remind us everywhere to prepare for such natural disasters. Coastal communities around the world need to be ready for these powerful storms.
Notable Hurricane Records in Different Ocean Basins
Each ocean has its unique hurricane records. Let’s look at the most amazing ones from around the world.
North Atlantic Ocean
Hurricane Wilma in the North Atlantic set the record for lowest pressure. On October 19, 2005, it hit a minimum of 882 millibars (26.05 inches of mercury). Wilma’s extreme low pressure led to its massive destruction.
Eastern Pacific Ocean
Hurricane Patricia in the Eastern Pacific broke the record for highest sustained winds. On October 23, 2015, winds reached 215 mph (345 km/h). It beat the old record set by Hurricane Linda in 1997, making Patricia one of the strongest hurricanes recorded.
Western Pacific Ocean
The Western Pacific is known for intense storms. Typhoon Tip, from 1979, stands out. It had a record low pressure of 870 millibars (25.69 inches of mercury). Tip’s winds also hit a record at 190 mph (305 km/h), making it the most powerful in terms of wind.
These remarkable records highlight the power of hurricanes in different basins. They show us the destructive force of these storms. They also remind us why it’s crucial to be ready and take safety steps.
Conclusion
In conclusion, hurricanes are strong storms that need close watching, readiness, and safety actions. The effects of hurricanes can worsen because of rising sea levels and global warming. These factors lead to higher flood levels and more rain, making each storm more harmful.
Communities need to learn about hurricanes, how they start, and changes due to global warming. Knowing the risks and having plans like evacuations and warnings helps protect us from these fierce storms.
For more information on the impacts of global warming on hurricanes, you can visit this resource.
It’s also important to say that human activities haven’t clearly changed Atlantic hurricane activity yet. They might affect things like sudden strengthening and more rain in certain areas. But, finding long-term changes is hard because of natural ups and downs. So, continuing research and keeping an eye on hurricanes is key to getting better at dealing with them.